Showing posts with label demographics. Show all posts

Saturday, October 22, 2011

A Dumbing Demographic Presents Special Challenges to the Next Level

The gravity of Europe’s demographic situation became clear at a conference I attended in Singapore last year. Dieter Salomon, the green mayor of the environmentally correct Freiburg, Germany, was speaking about the future of cities. When asked what Germany’s future would be like in 30 years, he answered, with a little smile, ”There won’t be a future.”

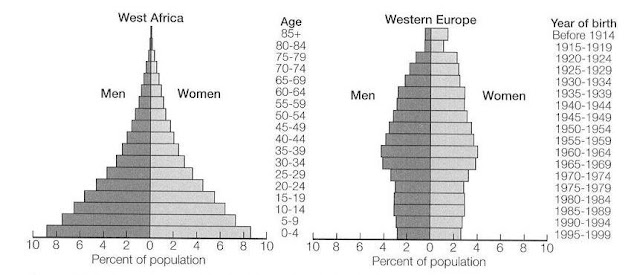
Herr Mayor was not exaggerating. For decades, Europe has experienced some of the world’s slowest population growth rates. Fertility rates have dropped well below replacement rates, and are roughly 50% lower than those in the U.S. Over time these demographic trends will have catastrophic economic consequences. By 2050, Europe, now home to 730 million people, will shrink by 75 million to 100 million and its workforce will be 25% smaller than in 2000._JoelKotkin_Forbes

When a welfare state is in the throes of a shrinking demographic, the implications are extremely dire. Guarantees of benefits in these nations is based upon a pyramid scheme, with the older pensioners near the apex and the younger taxpayers near the base. If the positions are reversed due to a collapsing demographic, national debt tends to grow to massive proportions rather quickly.
The fiscal costs of this process are already evident. Countries like Spain, Italy and Greece, which rank among the most rapidly aging populations in the world, are teetering on the verge of bankruptcy. One reason has to do with the lack enough productive workers to pay for generous pensions and other welfare-state provisions.

Germany, the über-economy of the continent, has little hope of avoiding the demographic winter either. By 2030 Germany will have about 53 retirees for every 100 people in its workforce; by comparison the U.S. ratio will be closer to 30. As a result, Germany will face a giant debt crisis, as social costs for the aging eat away its currently frugal and productive economy. According to the American Enterprise Institute’s Nick Eberstadt, by 2020 Germany debt service compared to GDP will rise to twice that currently suffered by Greece. _Forbes_Kotkin

The United States under Obama has been trying to imitate the European style of government -- a designed expansion of the public sector at the expense of the private sector. Fortunately for Obama -- in one sense -- the US is not suffering the same demographic collapse as Europe. The US is instead still growing demographically, due to immigration and due to higher birthrates among immigrants.
But in another sense, the US population growth is not as fortunate as it appears. The new replacement populations coming into the US are, on average, of lower aptitude in a cognitive sense. Average IQ of the US population is almost certain to drop as a result, and US global comptetiveness will be strained, consequently.

Trends in SAT test scores are an early warning of this very phenomenon:
"The scores are disappointing, and it seems to be a trend over the last five to six years, with drops across the board," said Jim Hull, senior policy analyst for the National School Board Association's Center for Public Education.

He called 10 points "a pretty significant change."

"It raises a red flag," he said. _WashingtonExaminer

Test score drops will be blamed on a number of factors, but the studiously ignored central cause of this trend is the lowered cognitive potential of modern students. And it is only likely to get worse. And the repercussions of this cognitive decline will spread throughout society -- and will be magnified tenfold by affirmative action policies.

The SAT has already been "dumbed down," perhaps in anticipation of this very phenomenon, but apparently it was not dumbed down enough. It will probably not be long before the ACT follows suit, in politically correct fashion. More: Steve Sailer takes a closer look at changes in SAT scores over the past several years, with stratification of scores by race.

A dumber population will place greater demands on governmental infrastructure. Law enforcement, welfare, education, housing, food subsidies, etc. will all have to grow more productive to compensate for a population of lower cognitive aptitudes.

National debt will increase even faster than at present, as the underlying society grows less capable of repaying their own debt on top of the debt of previous generations. Economic hardship will increase.

Multicultural societies are low-trust societies, which require much larger police forces to maintain order. As police forces are downsized due to the exponential growth in public sector union pensions and benefits, civil disorder will expand to fill the void.

Youth gangs made up almost entirely of immigrants, children of immigrants, and "minority" populations, will range the landscape virtually unimpeded by a law enforcement infrastructure that will grow more corrupt as it takes on the multi-cultural form of the new dominant populations of society. The initiation ritual for many of these gangs is likely to be an act of violence against the shrinking population of the formerly dominant, European descended people.

Can you and yours find a place of safety in this coming world? That depends upon what you do between now and then.

Hope for the best. Prepare for the worst.

Previously published on abu al-fin

For the architects of the Next Level, this dumbed down demographic -- a de facto Idiocracy -- presents special challenges. It will require working through alternative infrastructures other than traditional governmental institutions.

The creation of such "shadow governments" will not be easy, but it will not necessarily be as expensive as one might think. More on that later.

Monday, January 31, 2011

Wikimedia: Dumbing Down the Idiocracy?

NYT

Several areas of commerce, enterprise, and science remain the province of mainly-male participation. Physics, mathematics, advanced computer science, technical engineering, math-intensive sciences, aircraft test pilots and combat pilots, commercial sea captains, and so on. Most informed people understand that research is dominated by males, but few people realise that technical information intensive areas -- such as highly demanding reference information providers -- are also dominated by males. A lot of politically involved feminists would like to change that situation, but is there a danger in moving too forcefully from the top down when changes may adversely affect critically important services?
...surveys suggest that less than 15 percent of [Wikipedia's] hundreds of thousands of contributors are women.

About a year ago, the Wikimedia Foundation, the organization that runs Wikipedia, collaborated on a study of Wikipedia’s contributor base and discovered that it was barely 13 percent women; the average age of a contributor was in the mid-20s, according to the study by a joint center of the United Nations University and Maastricht University.

...The notion that a collaborative, written project open to all is so skewed to men may be surprising. After all, there is no male-dominated executive team favoring men over women, as there can be in the corporate world; Wikipedia is not a software project, but more a writing experiment — an “exquisite corpse,” or game where each player adds to a larger work.

...The public is increasingly going to Wikipedia as a research source: According to a recent Pew survey, the percentage of all American adults who use the site to look for information increased to 42 percent in May 2010, from 25 percent in February 2007. This translates to 53 percent of adults who regularly use the Internet.

Jane Margolis, co-author of a book on sexism in computer science, “Unlocking the Clubhouse,” argues that Wikipedia is experiencing the same problems of the offline world, where women are less willing to assert their opinions in public. “In almost every space, who are the authorities, the politicians, writers for op-ed pages?” said Ms. Margolis, a senior researcher at the Institute for Democracy, Education and Access at the University of California, Los Angeles.

...Ms. Gardner said that for now she was trying to use subtle persuasion and outreach through her foundation to welcome all newcomers to Wikipedia, rather than advocate for women-specific remedies like recruitment or quotas.

“Gender is a huge hot-button issue for lots of people who feel strongly about it,” she said. “I am not interested in triggering those strong feelings.”

Kat Walsh, a policy analyst and longtime Wikipedia contributor who was elected to the Wikimedia board, agreed that indirect initiatives would cause less unease in the Wikipedia community than more overt efforts.

But she acknowledged the hurdles: “The big problem is that the current Wikipedia community is what came about by letting things develop naturally — trying to influence it in another direction is no longer the easiest path, and requires conscious effort to change.” _NYT
The Wikipedia world is indeed a rough and tumble world of competitive edits and re-writes. If a person cannot withstand criticism and competition, they will not likely last long in that world.

The male hormone testosterone shapes the human brain in multiple ways not yet fully comprehended by science or society at large. Much of what science has learned about the influence of hormones such as testosterone on the gender differences so prevalent in society, is considered not politically correct -- and thus essentially unmentionable in left-leaning tabloids such as the New York Times, quoted above. Testosterone makes males more interested in objects than people, more competitive, have generally superior spatial and higher math skills, physically larger and stronger with greater stamina, tending to greater independence, and generally more logically determined and less emotional in the face of distractions.

Charles Murray's fascinating book, Human Accomplishment, provides a historical reflection of the phenomenon that Wikimedia's executives and critics are struggling with. Males have tended to achieve the lion's share of discoveries, inventions, and masterpieces of art, music, and literature as far back as history can tell.

A population shrinkage is occurring among the more intelligent people of the world -- Europeans and Northeast Asians -- while an explosive growth of population is occurring among the less intelligent people of the world. The average intelligence of the human population is inexorably dropping from near 90 points of IQ, downward -- close to the mid-80s and below. That qualifies as an Idiocracy.

In order to dumb down the Idiocracy, one must institute foolish rules of arbitrary and counter-productive governance, while educating the populace to accept dumbed-down groupthink rather than to think for themselves. It is easier than you might think. What Wikimedia is contemplating -- and what many western governments have done, and called affirmative action -- is an excellent example.

Saturday, April 24, 2010

World Demographics Profile

"There is a strong tendency for countries with lower national IQ scores to have higher fertility rates and for countries with higher national IQ scores to have lower fertility rates."[21] _Wiki


Wiki


A world map showing countries by fertility rate. Period 2005-2010
   7-8 Hijos / Children
   6-7 Hijos / Children
   5-6 Hijos / Children
   4-5 Hijos / Children
   3-4 Hijos / Children
   2-3 Hijos / Children
   0-2 Hijos / Children

Source: Swivel
RankCountryTotal fertility rate (children born/woman)
1Niger7.75
2Mali7.29
3Uganda6.77
4Afghanistan6.53
5Somalia6.52
6Burundi6.33
7Yemen6.32
8Burkina Faso6.28
9Congo, Democratic Republic of the6.2
10Ethiopia6.12
11Angola6.12
12Sierra Leone5.88
13Congo, Republic of the5.84
14Liberia5.79
15Malawi5.59
16Oman5.53
17Mayotte5.5
18Benin5.49
19Sao Tome and Principe5.33
20Chad5.31
21Rwanda5.25
22Guinea5.2
23Mozambique5.18
24Zambia5.15
25Madagascar5.14
26Equatorial Guinea5.08
27Djibouti5.06
28Gambia, The5.04
29Gaza Strip5.03
30Senegal4.95
31Nigeria4.91
32Comoros4.84
33Togo4.79
34Eritrea4.72
35Gabon4.65
36Guinea-Bissau4.65
37Kenya4.56
38Sudan4.48
39Tanzania4.46
40Mauritania4.45
41Laos4.41
42Cameroon4.33
43Samoa4.16
44Central African Republic4.14
45Cote d'Ivoire4.12
46Kiribati4.04
47Iraq3.86
48Saudi Arabia3.83
49Haiti3.81
50Paraguay3.75
51Zimbabwe3.69
52Ghana3.68
53Papua New Guinea3.62
54Pakistan3.6
55Marshall Islands3.59
56Solomon Islands3.52
57Guatemala3.47
58Belize3.36
59American Samoa3.29
60East Timor3.28
61Honduras3.27
62Philippines3.27
63Swaziland3.24
64West Bank3.22
65Bolivia3.17
66Syria3.12
67Libya3.08
68Cape Verde3.07
69Lesotho3.06
70Cambodia3.04
71El Salvador3
72Tajikistan2.99
73Turks and Caicos Islands2.95
74Malaysia2.95
75Tuvalu2.91
76Micronesia, Federated States of2.89
77Nauru2.85
78Kuwait2.76
79Dominican Republic2.76
80Israel2.75
81Bangladesh2.74
82India2.72
83Namibia2.69
84Egypt2.66
85Fiji2.65
86Kyrgyzstan2.65
87Nepal2.64
88Botswana2.6
89Nicaragua2.57
90Guam2.54
91Panama2.53
92Morocco2.51
93Ecuador2.51
94Vanuatu2.5
95Bahrain2.5
96Cook Islands2.49
97Venezuela2.48
98Colombia2.46
99Qatar2.45
100Faroe Islands2.44
101United Arab Emirates2.42
102Jordan2.39
103South Africa2.38
104Bhutan2.38
105Peru2.37
106Argentina2.35
107Mexico2.34
108Indonesia2.31
109Saint Kitts and Nevis2.26
110Jamaica2.25
111Tonga2.25
112Grenada2.23
113Mongolia2.23
114Turkmenistan2.22
115Turkey2.21
116Brazil2.21
117Greenland2.19
118New Caledonia2.18
119Costa Rica2.14
120New Zealand2.1
121Bahamas, The2.1
122Dominica2.09
123Antigua and Barbuda2.07
124United States2.05
125Azerbaijan2.04
126Guyana2.03
127Albania2.01
128Bermuda1.99
129Sri Lanka1.99
130Suriname1.99
131Saint Vincent and the Grenadines1.98
132France1.98
133Netherlands Antilles1.97
134Saint Pierre and Miquelon1.97
135Korea, North1.96
136Uzbekistan1.95
137Seychelles1.93
138Chile1.92
139Uruguay1.92
140French Polynesia1.92
141Brunei1.91
142Iceland1.9
143Maldives1.9
144Burma1.89
145Cayman Islands1.88
146Kazakhstan1.88
147Wallis and Futuna1.87
148Virgin Islands1.85
149Ireland1.85
150Lebanon1.85
151Aruba1.85
152Saint Lucia1.84
153Vietnam1.83
154Palau1.82
155Mauritius1.81
156Algeria1.79
157China1.79
158Australia1.78
159Luxembourg1.78
160Norway1.78
161Monaco1.75
162Anguilla1.75
163Denmark1.74
164Finland1.73
165Tunisia1.72
166Trinidad and Tobago1.72
167British Virgin Islands1.71
168Iran1.71
169Puerto Rico1.71
170Barbados1.68
171Sweden1.67
172United Kingdom1.66
173Netherlands1.66
174Belgium1.65
175Thailand1.65
176Gibraltar1.65
177Man, Isle of1.65
178Cuba1.61
179Canada1.58
180Macedonia, The Former Yugoslav Republic of1.58
181Jersey1.57
182Saint Helena1.56
183Liechtenstein1.52
184Malta1.51
185Portugal1.49
186Switzerland1.45
187Georgia1.44
188Estonia1.42
189Croatia1.42
190Bulgaria1.41
191Russia1.41
192Germany1.41
193Guernsey1.41
194Romania1.39
195Austria1.39
196Greece1.37
197Armenia1.36
198San Marino1.36
199Slovakia1.35
200Hungary1.35
201Andorra1.33
202Italy1.31
203Spain1.31
204Latvia1.3
205Slovenia1.28
206Poland1.28
207Moldova1.27
208Ukraine1.26
209Bosnia and Herzegovina1.25
210Belarus1.24
211Czech Republic1.24
212Lithuania1.23
213Montserrat1.23
214Korea, South1.21
215Japan1.21
216Northern Mariana Islands1.15
217Taiwan1.14
218Singapore1.09
219Hong Kong1.02
220Macau0.91
Definition: This entry gives a figure for the average number of children that would be born per woman if all women lived to the end of their childbearing years and bore children according to a given fertility rate at each age. The total fertility rate (TFR) is a more direct measure of the level of fertility than the crude birth rate, since it refers to births per woman. This indicator shows the potential for population change in the country. A rate of two children per woman is considered the replacement rate for a population, resulting in relative stability in terms of total numbers. Rates above two children indicate populations growing in size and whose median age is declining. Higher rates may also indicate difficulties for families, in some situations, to feed and educate their children and for women to enter the labor force. Rates below two children indicate populations decreasing in size and growing older. Global fertility rates are in general decline and this trend is most pronounced in industrialized countries, especially Western Europe, where populations are projected to decline dramatically over the next 50 years.
Source: CIA World Factbook - Unless otherwise noted, information in this page is accurate as of January 1, 2009
Source: Index Mundi


The TFR can be used as an estimate of the fertility growth factor in a population, e.g., whether the childbearing population is replacing itself or not. A TFR of 2,000 or above indicates that, on the average, couples are producing at least two children to replace themselves. When the TFR exceeds 2,000 for an extended period, the next generation of childbearing age will probably be larger than the present population of that age if all other factors affecting the population, such as death rates and migration, remain constant. Pennsylvania's TFR has been under 2,000 since 1972. However, it has remained relatively stable since then, although still below replacement level. The TFR is not meant to be used as an absolute measure of population trends, but can be helpful in understanding and analyzing them. There are many other factors to consider when determining population trends, such as crude birth rates, death rates and migration patterns. In fact, it would take several generations of a childbearing population maintaining a replacement level to just stabilize a specific population, again given that other factors, mainly age-specific death rates, were also maintained.
To obtain the 1996 TFR for Pennsylvania, compute the following:


Age of
Mother
Number of
Live Births
Female
Population
Age-Specific
Rate
10-14367/387,341x1000=0.9
15-1915,267/408,422x1000=37.4
20-2430,613/403,191x1000=75.9
25-2942,245/397,398x1000=106.3
30-3439,105/446,488x1000=87.6
35-3917,378/469,810x1000=37.0
40-442,808/458,439x1000=6.1
45-4994/413,377x1000=0.2
Sum351.4
The TFR is the sum of the age-specific birth rates multiplied by five or (351.4 x 5 = 1757.0).
Population Pyramids