Sunday, April 25, 2010

Spallation Drilling for Deep Geothermal Wells

Seeker Blog article on geothermal energy suggests that spallation drilling should provide an economic means for drilling at the necessary depths for high quality heat.

Hydrothermal spallation was invented and patented by cofounder Bob Potter and Jefferson Tester of MIT. The patent is owned by MIT and licensed exclusively to Potter Drilling.
An animation of how hydrothermal spallation works.


An animation of how hydrothermal spallation works.
Chad Augustine MIT PhD Thesis Chemical Engineering

Summary of Potter Geothermal project funded by US DOE

Description of hydrothermal spallation drilling at Energy Boom

2006 Technology Review interview with patent holder Jefferson Tester

Saturday, April 24, 2010

World Demographics Profile

"There is a strong tendency for countries with lower national IQ scores to have higher fertility rates and for countries with higher national IQ scores to have lower fertility rates."[21] _Wiki


Wiki


A world map showing countries by fertility rate. Period 2005-2010
   7-8 Hijos / Children
   6-7 Hijos / Children
   5-6 Hijos / Children
   4-5 Hijos / Children
   3-4 Hijos / Children
   2-3 Hijos / Children
   0-2 Hijos / Children

Source: Swivel
RankCountryTotal fertility rate (children born/woman)
1Niger7.75
2Mali7.29
3Uganda6.77
4Afghanistan6.53
5Somalia6.52
6Burundi6.33
7Yemen6.32
8Burkina Faso6.28
9Congo, Democratic Republic of the6.2
10Ethiopia6.12
11Angola6.12
12Sierra Leone5.88
13Congo, Republic of the5.84
14Liberia5.79
15Malawi5.59
16Oman5.53
17Mayotte5.5
18Benin5.49
19Sao Tome and Principe5.33
20Chad5.31
21Rwanda5.25
22Guinea5.2
23Mozambique5.18
24Zambia5.15
25Madagascar5.14
26Equatorial Guinea5.08
27Djibouti5.06
28Gambia, The5.04
29Gaza Strip5.03
30Senegal4.95
31Nigeria4.91
32Comoros4.84
33Togo4.79
34Eritrea4.72
35Gabon4.65
36Guinea-Bissau4.65
37Kenya4.56
38Sudan4.48
39Tanzania4.46
40Mauritania4.45
41Laos4.41
42Cameroon4.33
43Samoa4.16
44Central African Republic4.14
45Cote d'Ivoire4.12
46Kiribati4.04
47Iraq3.86
48Saudi Arabia3.83
49Haiti3.81
50Paraguay3.75
51Zimbabwe3.69
52Ghana3.68
53Papua New Guinea3.62
54Pakistan3.6
55Marshall Islands3.59
56Solomon Islands3.52
57Guatemala3.47
58Belize3.36
59American Samoa3.29
60East Timor3.28
61Honduras3.27
62Philippines3.27
63Swaziland3.24
64West Bank3.22
65Bolivia3.17
66Syria3.12
67Libya3.08
68Cape Verde3.07
69Lesotho3.06
70Cambodia3.04
71El Salvador3
72Tajikistan2.99
73Turks and Caicos Islands2.95
74Malaysia2.95
75Tuvalu2.91
76Micronesia, Federated States of2.89
77Nauru2.85
78Kuwait2.76
79Dominican Republic2.76
80Israel2.75
81Bangladesh2.74
82India2.72
83Namibia2.69
84Egypt2.66
85Fiji2.65
86Kyrgyzstan2.65
87Nepal2.64
88Botswana2.6
89Nicaragua2.57
90Guam2.54
91Panama2.53
92Morocco2.51
93Ecuador2.51
94Vanuatu2.5
95Bahrain2.5
96Cook Islands2.49
97Venezuela2.48
98Colombia2.46
99Qatar2.45
100Faroe Islands2.44
101United Arab Emirates2.42
102Jordan2.39
103South Africa2.38
104Bhutan2.38
105Peru2.37
106Argentina2.35
107Mexico2.34
108Indonesia2.31
109Saint Kitts and Nevis2.26
110Jamaica2.25
111Tonga2.25
112Grenada2.23
113Mongolia2.23
114Turkmenistan2.22
115Turkey2.21
116Brazil2.21
117Greenland2.19
118New Caledonia2.18
119Costa Rica2.14
120New Zealand2.1
121Bahamas, The2.1
122Dominica2.09
123Antigua and Barbuda2.07
124United States2.05
125Azerbaijan2.04
126Guyana2.03
127Albania2.01
128Bermuda1.99
129Sri Lanka1.99
130Suriname1.99
131Saint Vincent and the Grenadines1.98
132France1.98
133Netherlands Antilles1.97
134Saint Pierre and Miquelon1.97
135Korea, North1.96
136Uzbekistan1.95
137Seychelles1.93
138Chile1.92
139Uruguay1.92
140French Polynesia1.92
141Brunei1.91
142Iceland1.9
143Maldives1.9
144Burma1.89
145Cayman Islands1.88
146Kazakhstan1.88
147Wallis and Futuna1.87
148Virgin Islands1.85
149Ireland1.85
150Lebanon1.85
151Aruba1.85
152Saint Lucia1.84
153Vietnam1.83
154Palau1.82
155Mauritius1.81
156Algeria1.79
157China1.79
158Australia1.78
159Luxembourg1.78
160Norway1.78
161Monaco1.75
162Anguilla1.75
163Denmark1.74
164Finland1.73
165Tunisia1.72
166Trinidad and Tobago1.72
167British Virgin Islands1.71
168Iran1.71
169Puerto Rico1.71
170Barbados1.68
171Sweden1.67
172United Kingdom1.66
173Netherlands1.66
174Belgium1.65
175Thailand1.65
176Gibraltar1.65
177Man, Isle of1.65
178Cuba1.61
179Canada1.58
180Macedonia, The Former Yugoslav Republic of1.58
181Jersey1.57
182Saint Helena1.56
183Liechtenstein1.52
184Malta1.51
185Portugal1.49
186Switzerland1.45
187Georgia1.44
188Estonia1.42
189Croatia1.42
190Bulgaria1.41
191Russia1.41
192Germany1.41
193Guernsey1.41
194Romania1.39
195Austria1.39
196Greece1.37
197Armenia1.36
198San Marino1.36
199Slovakia1.35
200Hungary1.35
201Andorra1.33
202Italy1.31
203Spain1.31
204Latvia1.3
205Slovenia1.28
206Poland1.28
207Moldova1.27
208Ukraine1.26
209Bosnia and Herzegovina1.25
210Belarus1.24
211Czech Republic1.24
212Lithuania1.23
213Montserrat1.23
214Korea, South1.21
215Japan1.21
216Northern Mariana Islands1.15
217Taiwan1.14
218Singapore1.09
219Hong Kong1.02
220Macau0.91
Definition: This entry gives a figure for the average number of children that would be born per woman if all women lived to the end of their childbearing years and bore children according to a given fertility rate at each age. The total fertility rate (TFR) is a more direct measure of the level of fertility than the crude birth rate, since it refers to births per woman. This indicator shows the potential for population change in the country. A rate of two children per woman is considered the replacement rate for a population, resulting in relative stability in terms of total numbers. Rates above two children indicate populations growing in size and whose median age is declining. Higher rates may also indicate difficulties for families, in some situations, to feed and educate their children and for women to enter the labor force. Rates below two children indicate populations decreasing in size and growing older. Global fertility rates are in general decline and this trend is most pronounced in industrialized countries, especially Western Europe, where populations are projected to decline dramatically over the next 50 years.
Source: CIA World Factbook - Unless otherwise noted, information in this page is accurate as of January 1, 2009
Source: Index Mundi


The TFR can be used as an estimate of the fertility growth factor in a population, e.g., whether the childbearing population is replacing itself or not. A TFR of 2,000 or above indicates that, on the average, couples are producing at least two children to replace themselves. When the TFR exceeds 2,000 for an extended period, the next generation of childbearing age will probably be larger than the present population of that age if all other factors affecting the population, such as death rates and migration, remain constant. Pennsylvania's TFR has been under 2,000 since 1972. However, it has remained relatively stable since then, although still below replacement level. The TFR is not meant to be used as an absolute measure of population trends, but can be helpful in understanding and analyzing them. There are many other factors to consider when determining population trends, such as crude birth rates, death rates and migration patterns. In fact, it would take several generations of a childbearing population maintaining a replacement level to just stabilize a specific population, again given that other factors, mainly age-specific death rates, were also maintained.
To obtain the 1996 TFR for Pennsylvania, compute the following:


Age of
Mother
Number of
Live Births
Female
Population
Age-Specific
Rate
10-14367/387,341x1000=0.9
15-1915,267/408,422x1000=37.4
20-2430,613/403,191x1000=75.9
25-2942,245/397,398x1000=106.3
30-3439,105/446,488x1000=87.6
35-3917,378/469,810x1000=37.0
40-442,808/458,439x1000=6.1
45-4994/413,377x1000=0.2
Sum351.4
The TFR is the sum of the age-specific birth rates multiplied by five or (351.4 x 5 = 1757.0).
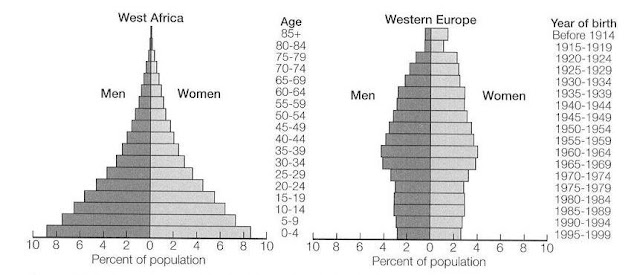
Population Pyramids